
Website Speed & Core Web Vitals: The Silent Revenue Killer Costing Your Business Customers
There's a leak in your business that doesn't show up on any report.
It doesn't appear in your accounting software. Your ad dashboard won't flag it. Google Analytics buries it three menus deep. And yet, for most small businesses, it quietly destroys more revenue than a bad review, a broken phone line, or a competitor's price cut ever could.
It's your website's loading speed.
Here's the uncomfortable math: if your website takes five seconds to load — which is faster than the average small business site — you're losing roughly 9 out of every 10 mobile visitors before they see a single word of your carefully written homepage. The ad money you spent to get them there? Gone. The Google ranking you worked for? Slipping. The customer? Already on a competitor's site.
This guide is the complete picture: what website performance actually means in 2026, exactly how it affects your rankings and revenue (with the numbers), how to diagnose your own site in ten minutes, and what separates permanently fast websites from ones that need constant patching.
Grab a coffee. By the end, you'll know more about web performance than most agencies selling it.
Part 1: What "Performance" Actually Means (It's Not One Number)
When most business owners think about website speed, they picture a single stopwatch: page loads in X seconds. The reality is more nuanced — and understanding it matters, because Google measures your site the nuanced way.
Modern performance is measured across three dimensions:
Loading — How quickly does the main content appear? Not the spinner, not the background color — the actual headline, image, or product the visitor came to see.
Interactivity — Once things appear, how quickly does the page respond? Can the visitor tap the menu, click "Book Now," start scrolling — or does the page freeze while scripts finish loading?
Visual stability — Does the page hold still, or do buttons and text jump around as ads, images, and fonts pop in? (Everyone has experienced tapping a button just as the layout shifted and hitting something else entirely. That's a measurable — and penalized — failure.)
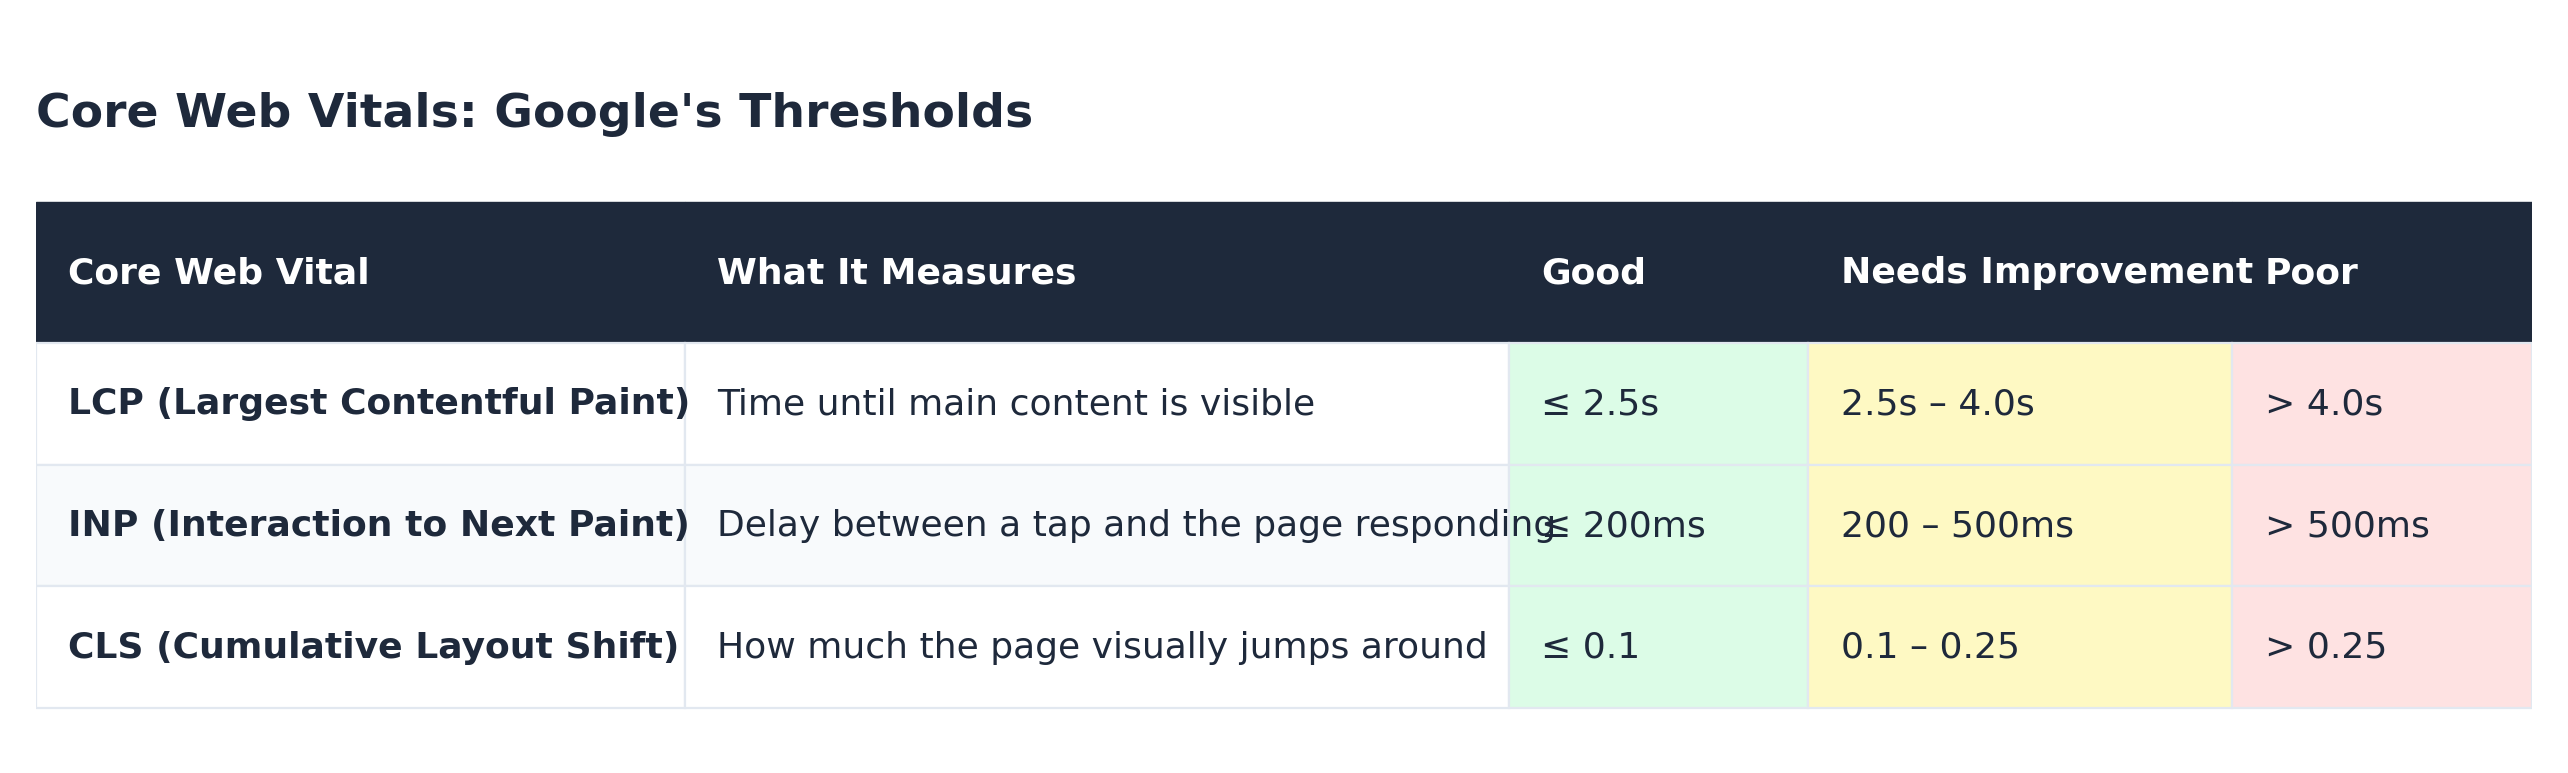
Google formalized these three dimensions into the Core Web Vitals, and they are now a confirmed ranking factor. The three metrics are LCP (Largest Contentful Paint — main content visible within 2.5 seconds), INP (Interaction to Next Paint — the page responds to taps within 200ms), and CLS (Cumulative Layout Shift — the page holds visually still). Here's where Google draws the lines:
Two things make these metrics different from the old "page speed" scores:
They're measured on real visitors, not lab tests. Google collects field data from actual Chrome users on your site — real phones, real cell networks, real patience levels. You can't game it with a fast office connection.
They're measured per page, mostly on mobile. Your homepage might pass while your service pages fail. And since over 60% of local business traffic is mobile, mobile performance is your performance.
Part 2: The Revenue Math — What Slow Actually Costs You
Performance sounds technical until you translate it into money. Let's do that.
Speed vs. Abandonment
The relationship between load time and visitor abandonment has been studied relentlessly by Google, Deloitte, Akamai, and others, and the findings all point the same direction: every additional second of load time sharply increases the probability a visitor gives up.
Google's own mobile research produced the most cited figures — going from a 1-second load to 3 seconds increases bounce probability by 32%, and by 5 seconds it has nearly doubled at +90%:
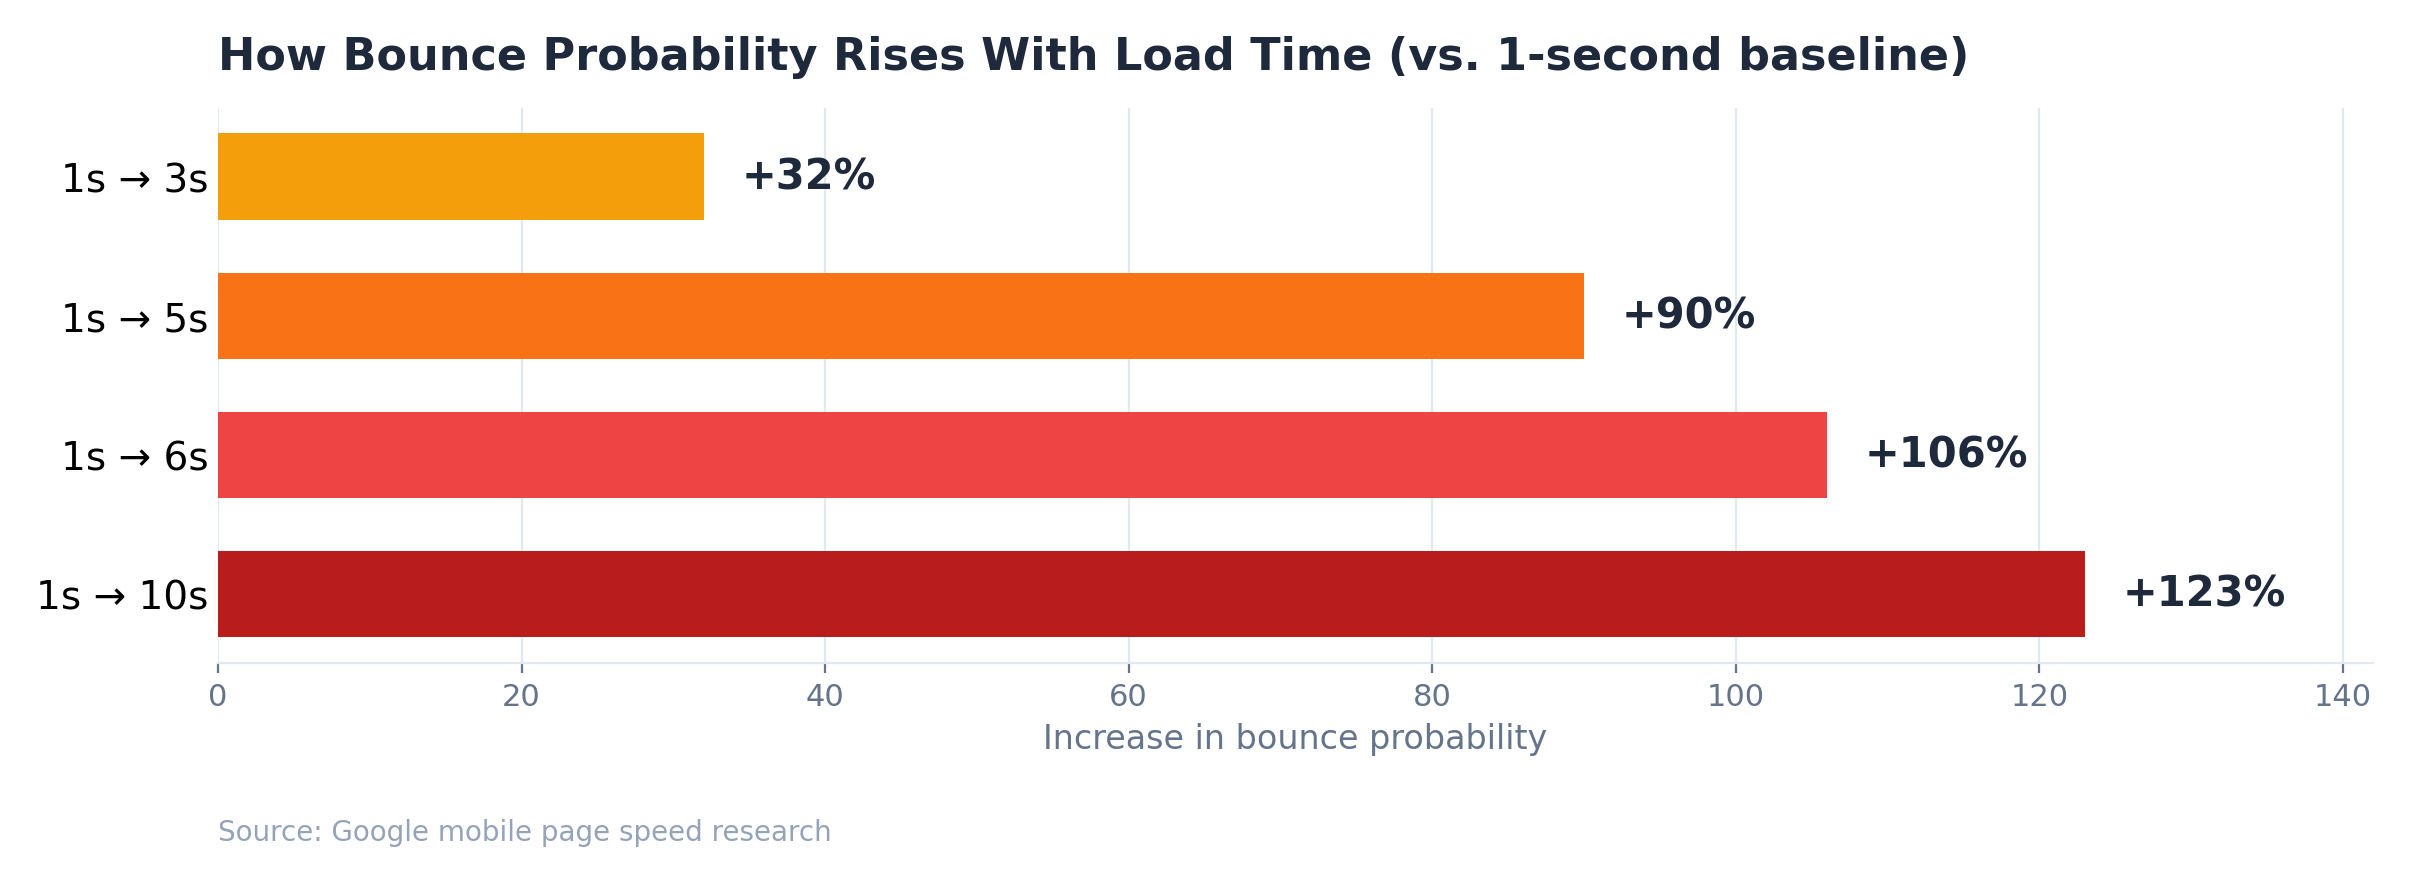
Read that again with your business hat on: the difference between a 1-second site and a 5-second site is nearly double the abandonment rate — before a single visitor has judged your prices, your photos, or your copy.
Speed vs. Conversions
Bounce rate is only half the story. Among visitors who stay, speed still shapes whether they convert. Sites loading under 1 second convert at roughly 2.5–3x the rate of 5-second sites, and studies consistently show around 4% or more conversion loss per extra second in the 3–5 second range:
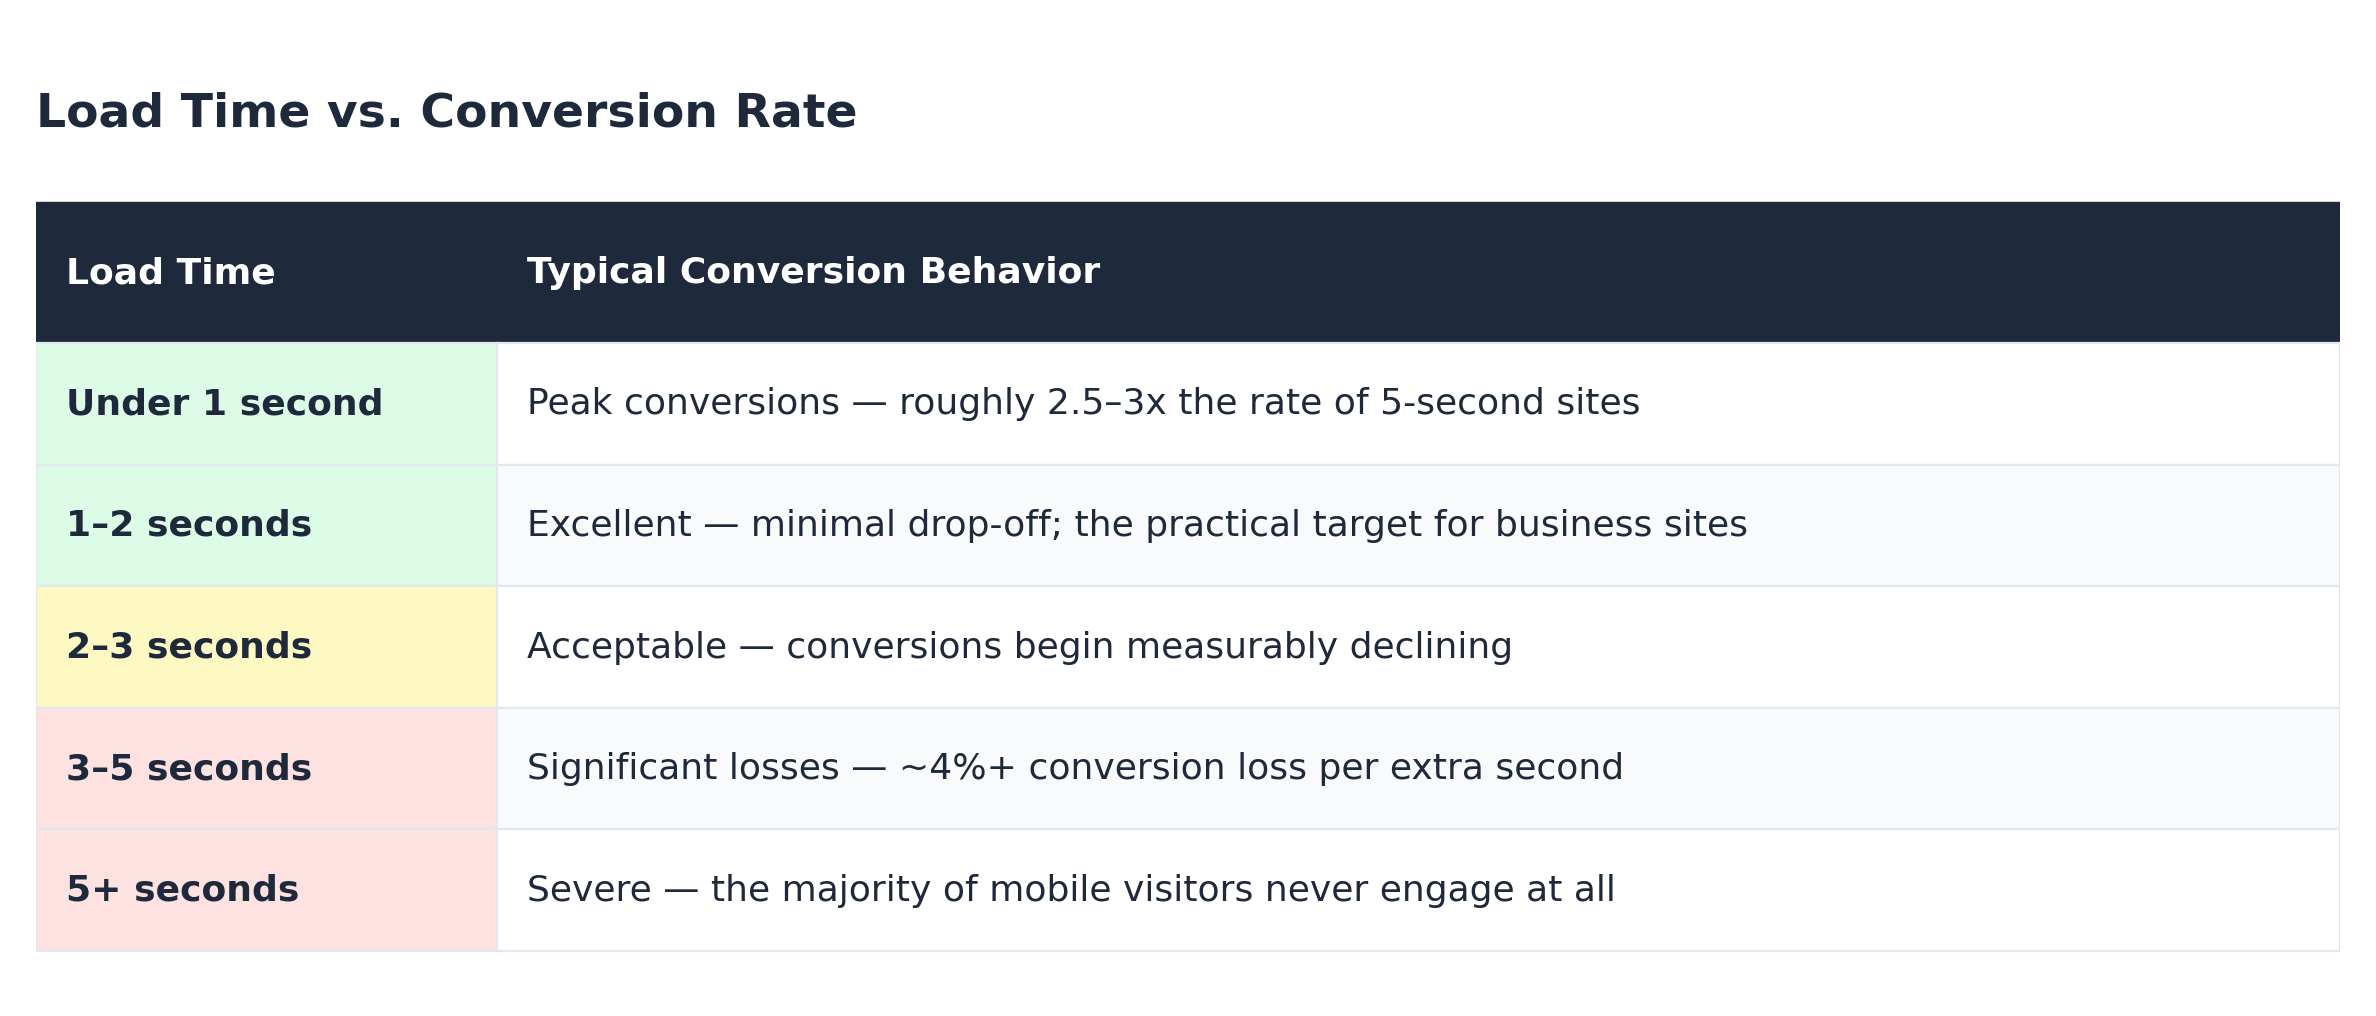
Walmart famously found that every 1-second improvement in load time increased conversions by around 2%. Deloitte's landmark study of retail and travel brands found that a 0.1-second improvement — one-tenth of one second — measurably lifted conversion rates and average order values. If a tenth of a second moves the needle for billion-dollar brands with world-class sites, imagine what three full seconds is doing to yours.
A Worked Example for a Local Business
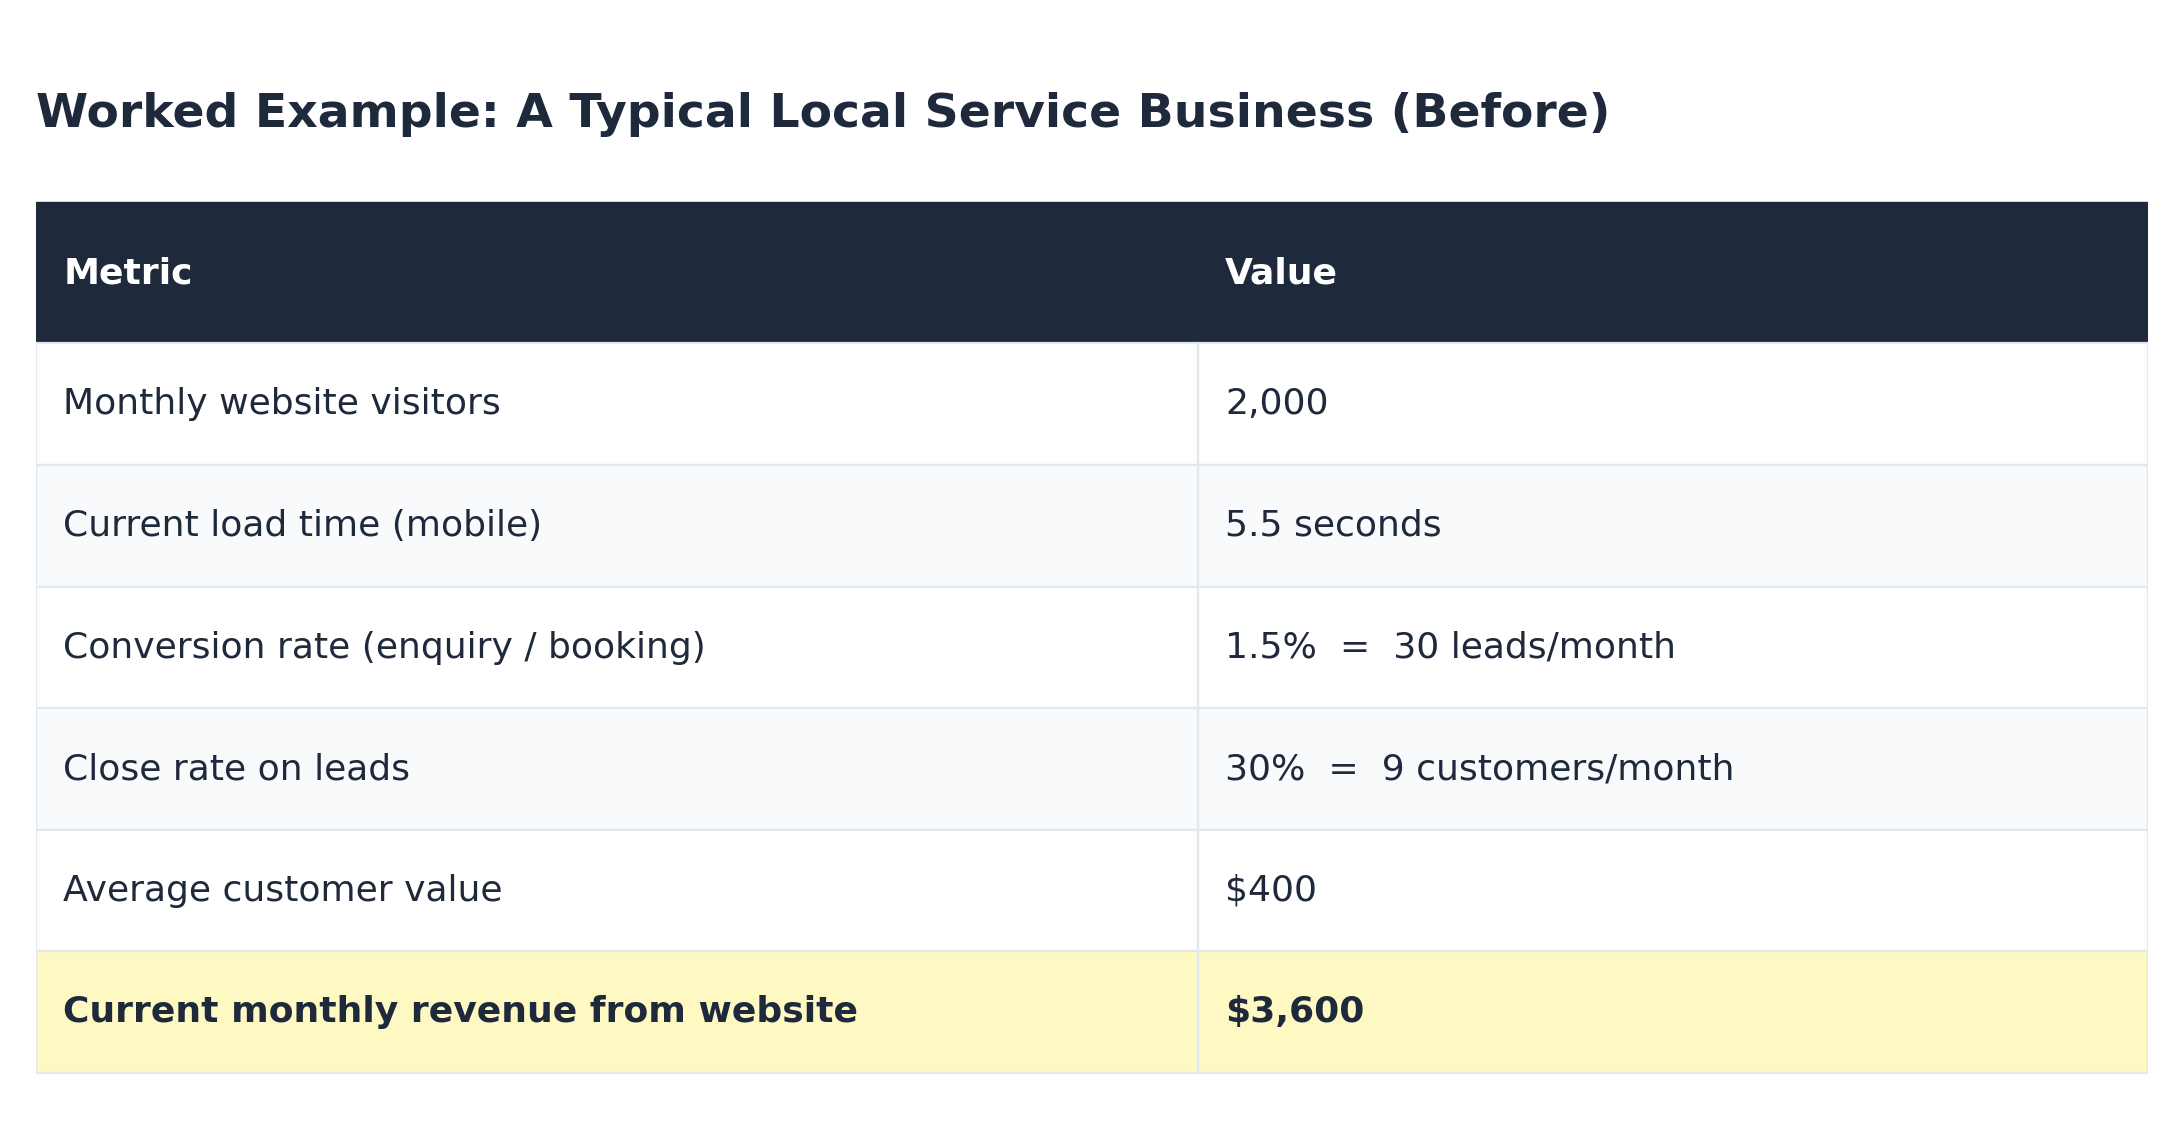
Let's make it concrete. Say you run a service business — contractor, clinic, salon, consultancy — with 2,000 monthly visitors, a 5.5-second mobile load time, a 1.5% enquiry rate, a 30% close rate, and a $400 average customer value. That website currently produces about $3,600 per month:
Now apply conservative, well-documented improvements from getting that load time under 2 seconds — fewer bounces mean about 25% more visitors actually engage, and the conversion rate on those engaged visitors rises from 1.5% to 2.2%:
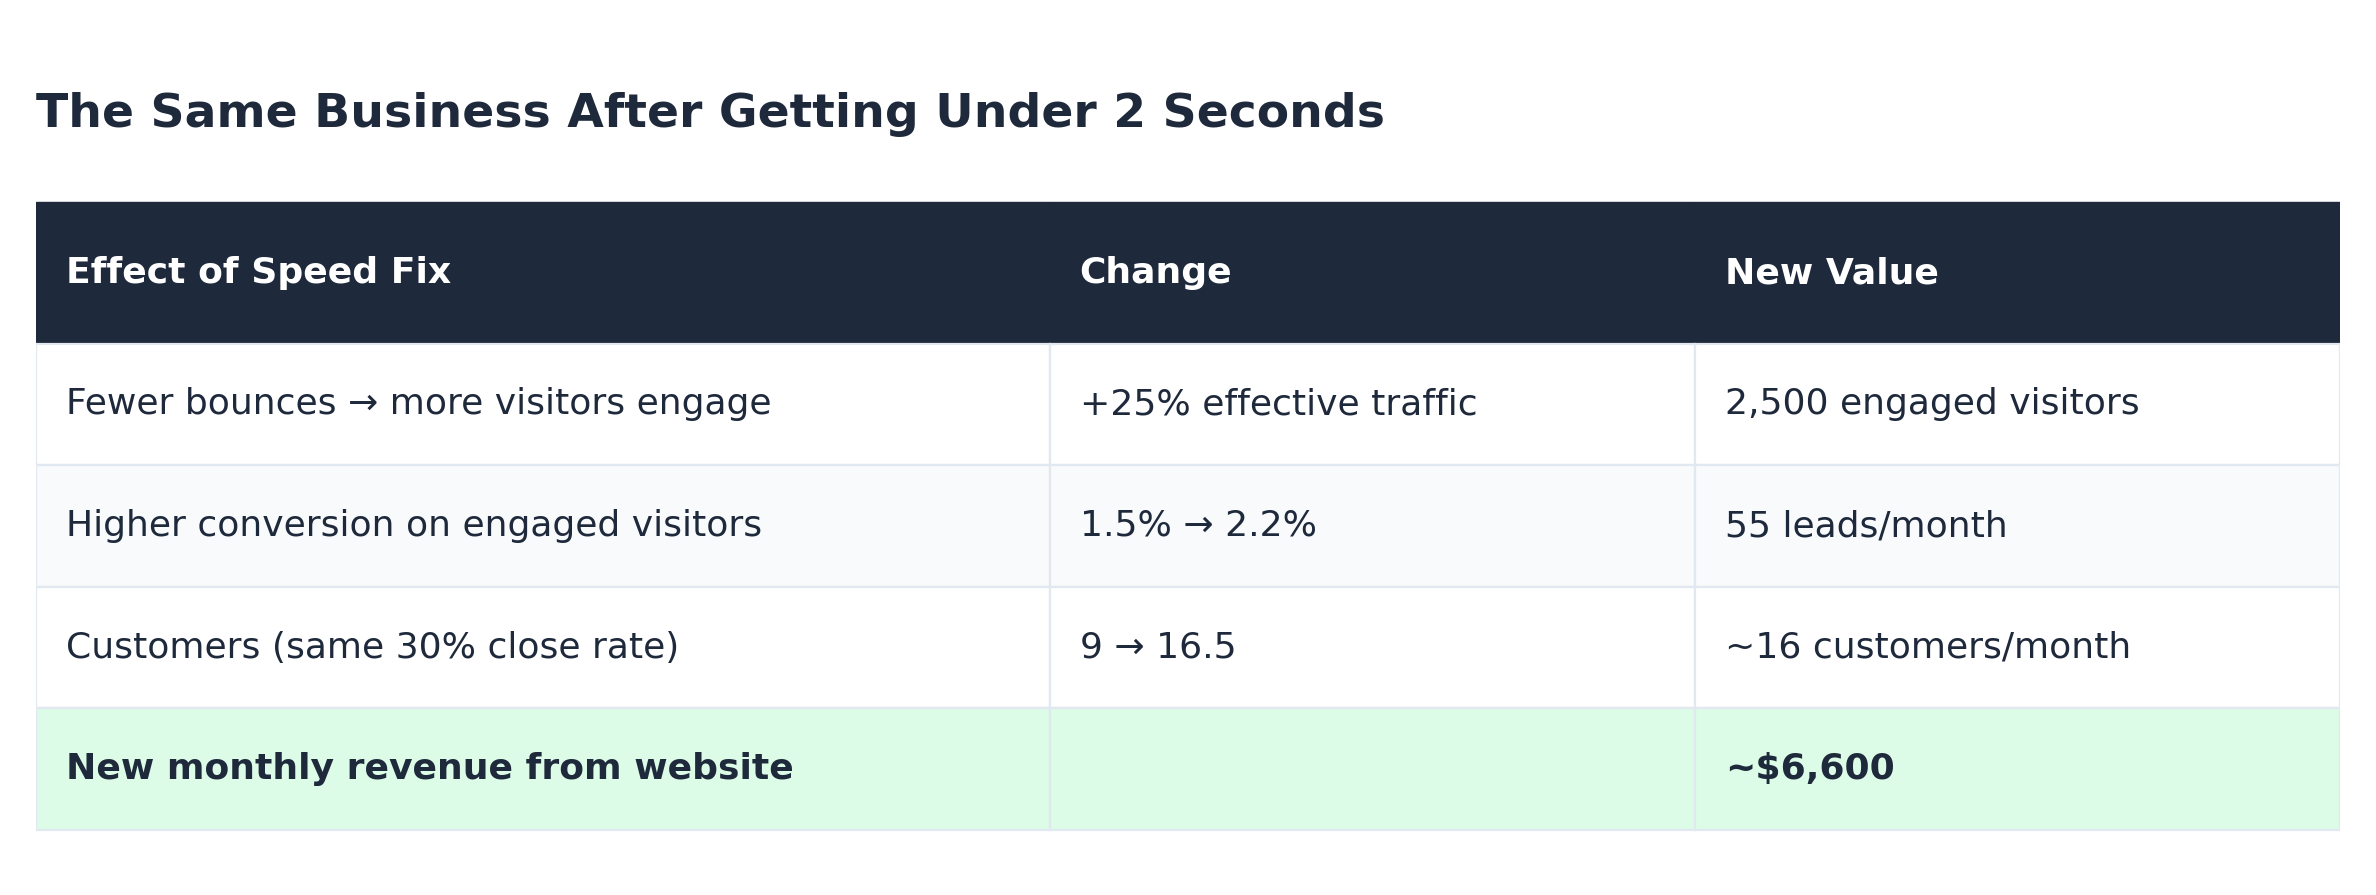
That's roughly $36,000 per year recovered — from the same traffic, the same ad spend, the same sales process. No marketing tactic in this price range comes close. And this is before counting the SEO ranking gains that faster sites earn, which compound the traffic itself.
Part 3: The SEO Dimension — Speed as a Ranking Signal
Core Web Vitals are a confirmed Google ranking factor, but the honest picture is more interesting than "fast site = rank #1."
Speed influences your rankings through three channels:
Direct signal. When two pages are otherwise comparable, the one with healthy Core Web Vitals gets the edge. In competitive local markets — where five plumbers all have decent websites and similar reviews — this tiebreaker is real.
Crawl efficiency. Google allocates a "crawl budget" to your site. Slow servers mean Google crawls fewer pages less often, so your new content and updates take longer to appear in search results. For businesses publishing local content (as we recommended in our $0 lead generation strategy), a slow site literally delays your marketing.
Behavioral feedback. This is the big one. Google watches how searchers behave. When users click your result, wait, give up, and return to the search results to click a competitor — a pattern called "pogo-sticking" — it's a strong signal your page didn't satisfy the search. Slow pages generate this signal constantly. Over time, your rankings erode not because Google timed your server, but because your own visitors kept voting against you.
The takeaway: speed isn't a separate SEO project. It's the foundation that determines whether every other SEO effort — content, links, reviews — gets full credit or leaks value.
Part 4: Diagnose Your Site in 10 Minutes
Before fixing anything, measure. Here's the exact process, using free tools:
Step 1 — PageSpeed Insights (2 minutes). Go to pagespeed.web.dev and enter your homepage URL. Look at two sections: the field data at the top (real-visitor Core Web Vitals, if your site has enough traffic) and the lab scores below. Check mobile first — that's what most of your visitors and Google care about.
Step 2 — Test your money pages (3 minutes). Repeat for your service pages, booking/contact page, and a blog post. Performance varies wildly page to page, and your conversion-critical pages matter most.
Step 3 — The real phone test (2 minutes). Open your site on an actual phone using cellular data (not office Wi-Fi), ideally after clearing your browser cache. Count the seconds before you could read the headline and tap a button. This subjective test often reveals what dashboards hide.
Step 4 — Search Console (3 minutes). If you have Google Search Console set up, open the Core Web Vitals report. It shows exactly which page groups Google classifies as Poor, Needs Improvement, or Good — in Google's own eyes, which is ultimately what counts.
Reading Your Results
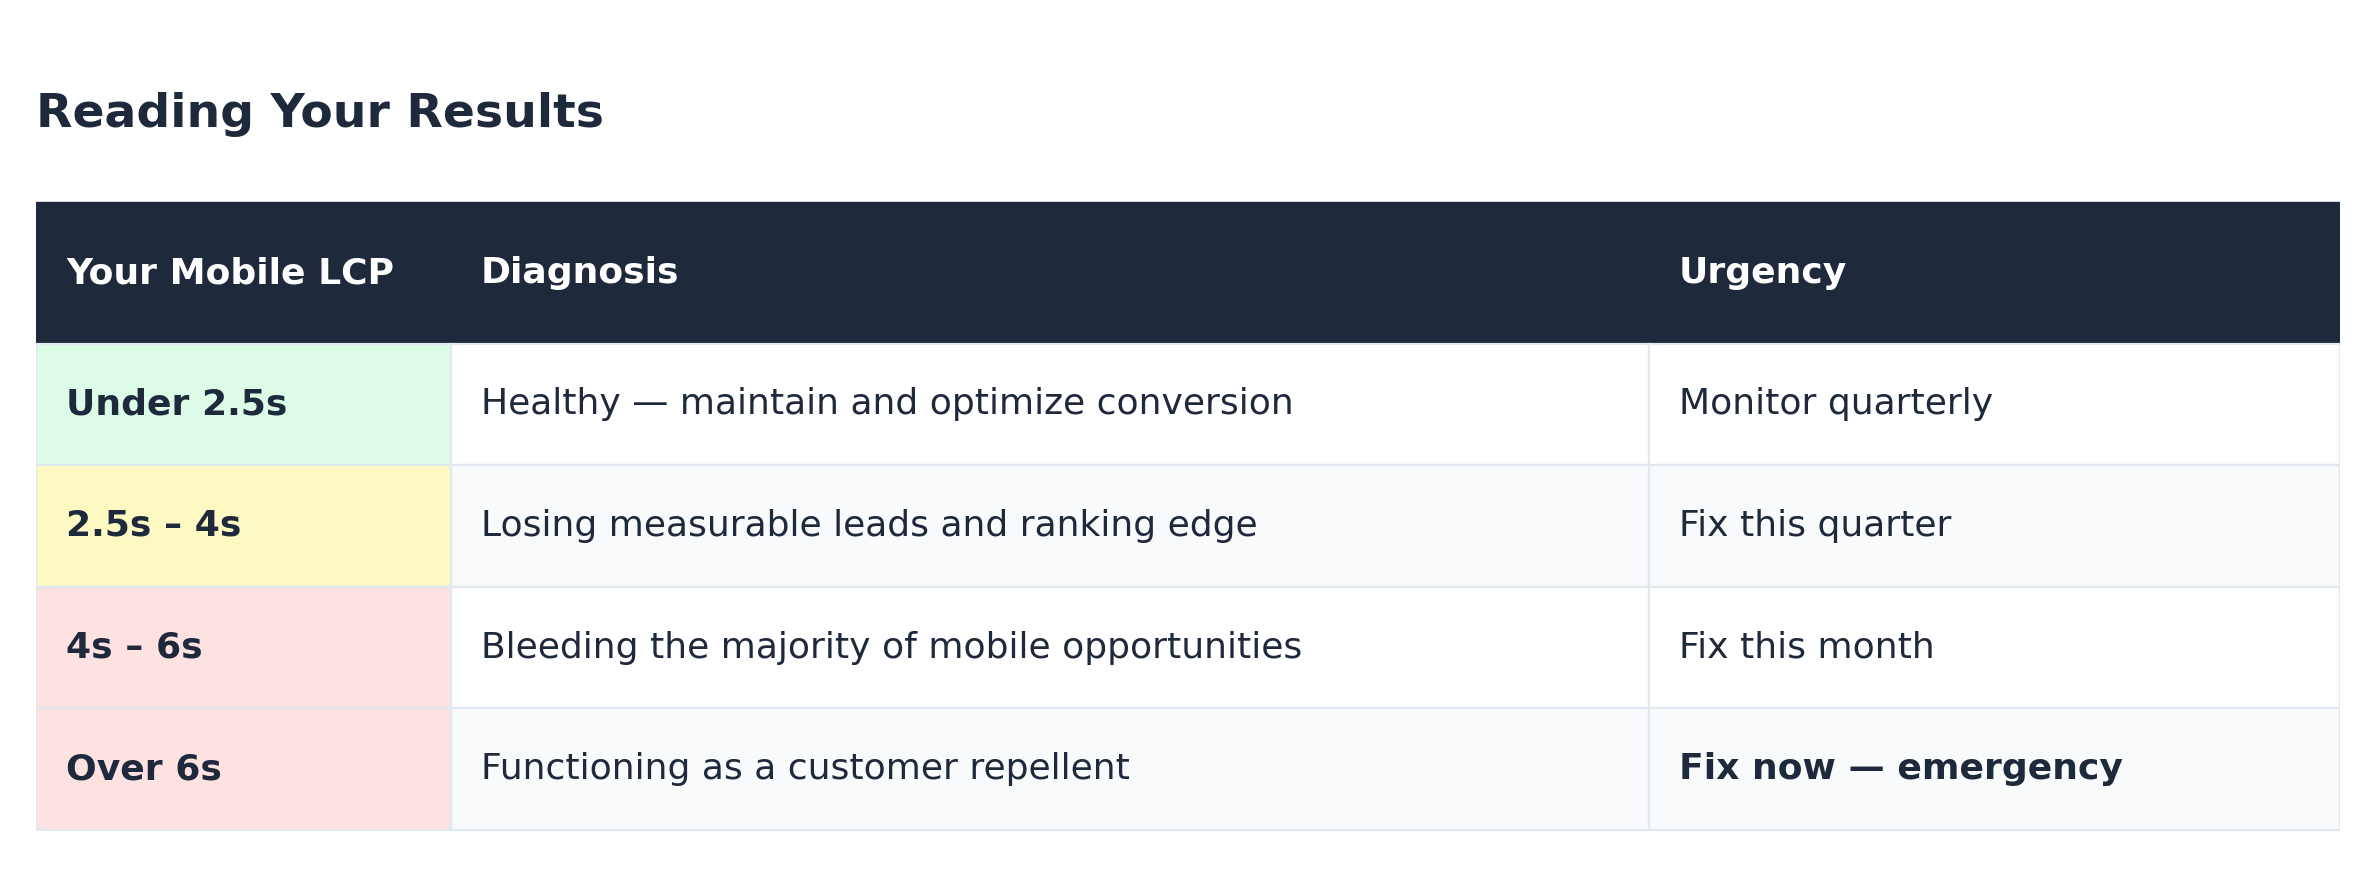
A mobile LCP under 2.5 seconds is healthy. Between 2.5 and 4 seconds you're losing measurable leads. Beyond 4 seconds, you're bleeding the majority of your mobile opportunities — and beyond 6, it's an emergency:
Part 5: Why Sites Are Slow — The Usual Suspects
Nearly every slow small-business website suffers from some combination of the same seven problems:
1. Oversized images. The #1 culprit by far. A 4MB photo straight off a phone camera, displayed at 400 pixels wide, forces every visitor to download ten times more data than needed. Multiply by fifteen images per page and cellular connections choke.
2. Plugin and script bloat. This is the WordPress trap. Each plugin — sliders, forms, galleries, SEO tools, page builders — loads its own JavaScript and CSS on every page, whether used or not. Sites with 30+ plugins routinely ship several megabytes of code before content appears. Add third-party scripts (chat widgets, multiple analytics tools, tracking pixels, font libraries) and the browser is juggling dozens of requests before it can paint your headline.
3. Cheap shared hosting. When your site shares a server with 500 others, its response time depends on your neighbors' traffic. The time to first byte — how long the server takes to even begin responding — can eat a full second before anything else happens.
4. No caching or CDN. Without caching, the server rebuilds each page from scratch for every visitor. Without a CDN (content delivery network), a visitor far from your server waits on data crossing continents. Both fixes are standard on modern platforms and mysteriously absent on many business sites.
5. Render-blocking code. Scripts and stylesheets loaded in the wrong order force the browser to stop and wait. The page is technically "loading" — the visitor just sees white.
6. Layout shift bombs. Images without defined dimensions, late-loading fonts, and injected banners cause the page to jump as it loads — tanking your CLS score and frustrating users into misclicks.
7. Theme/page-builder overhead. Visual page builders generate notoriously heavy markup. A page that could be 50KB of clean code ships as 500KB of nested wrappers, unused styles, and builder scripts.
Notice a pattern: most of these aren't "settings you forgot to enable." They're architectural — consequences of how the site was built and what it was built on.
Part 6: The Fix — Patching vs. Rebuilding on a Fast Foundation
There are two philosophies for fixing a slow website, and being honest about the difference will save you money and frustration.
The Patching Path
If your site is moderately slow (LCP in the 2.5–4s range) and structurally sound, optimization can get you into the green:
Compress and convert all images to modern formats (WebP/AVIF), sized to their actual display dimensions, lazy-loaded below the fold.
Audit and cut plugins/scripts. Every plugin must justify its existence. Consolidate analytics. Load chat widgets after the page is interactive.
Add caching and a CDN. Full-page caching plus a CDN like Cloudflare is the single biggest infrastructure win available on a traditional stack.
Upgrade hosting from bargain shared plans to quality managed hosting.
Fix layout shift by defining image dimensions and preloading fonts.
Done well, this often cuts load times in half. But it comes with a permanent tax: on plugin-based platforms, performance is a maintenance battle. Every update, every new plugin, every new tracking pixel threatens to undo the work. You don't fix a WordPress site's speed once — you defend it forever.
The Foundation Path
The alternative is building on architecture where speed is the default, not an achievement. This is why modern frameworks like Next.js — deployed on edge networks like Vercel — have become the standard for performance-critical business sites. The difference shows up in every dimension that matters, right down to typical mobile LCP: 3–8 seconds on a plugin-heavy traditional stack versus under 1.5 seconds on a modern framework:
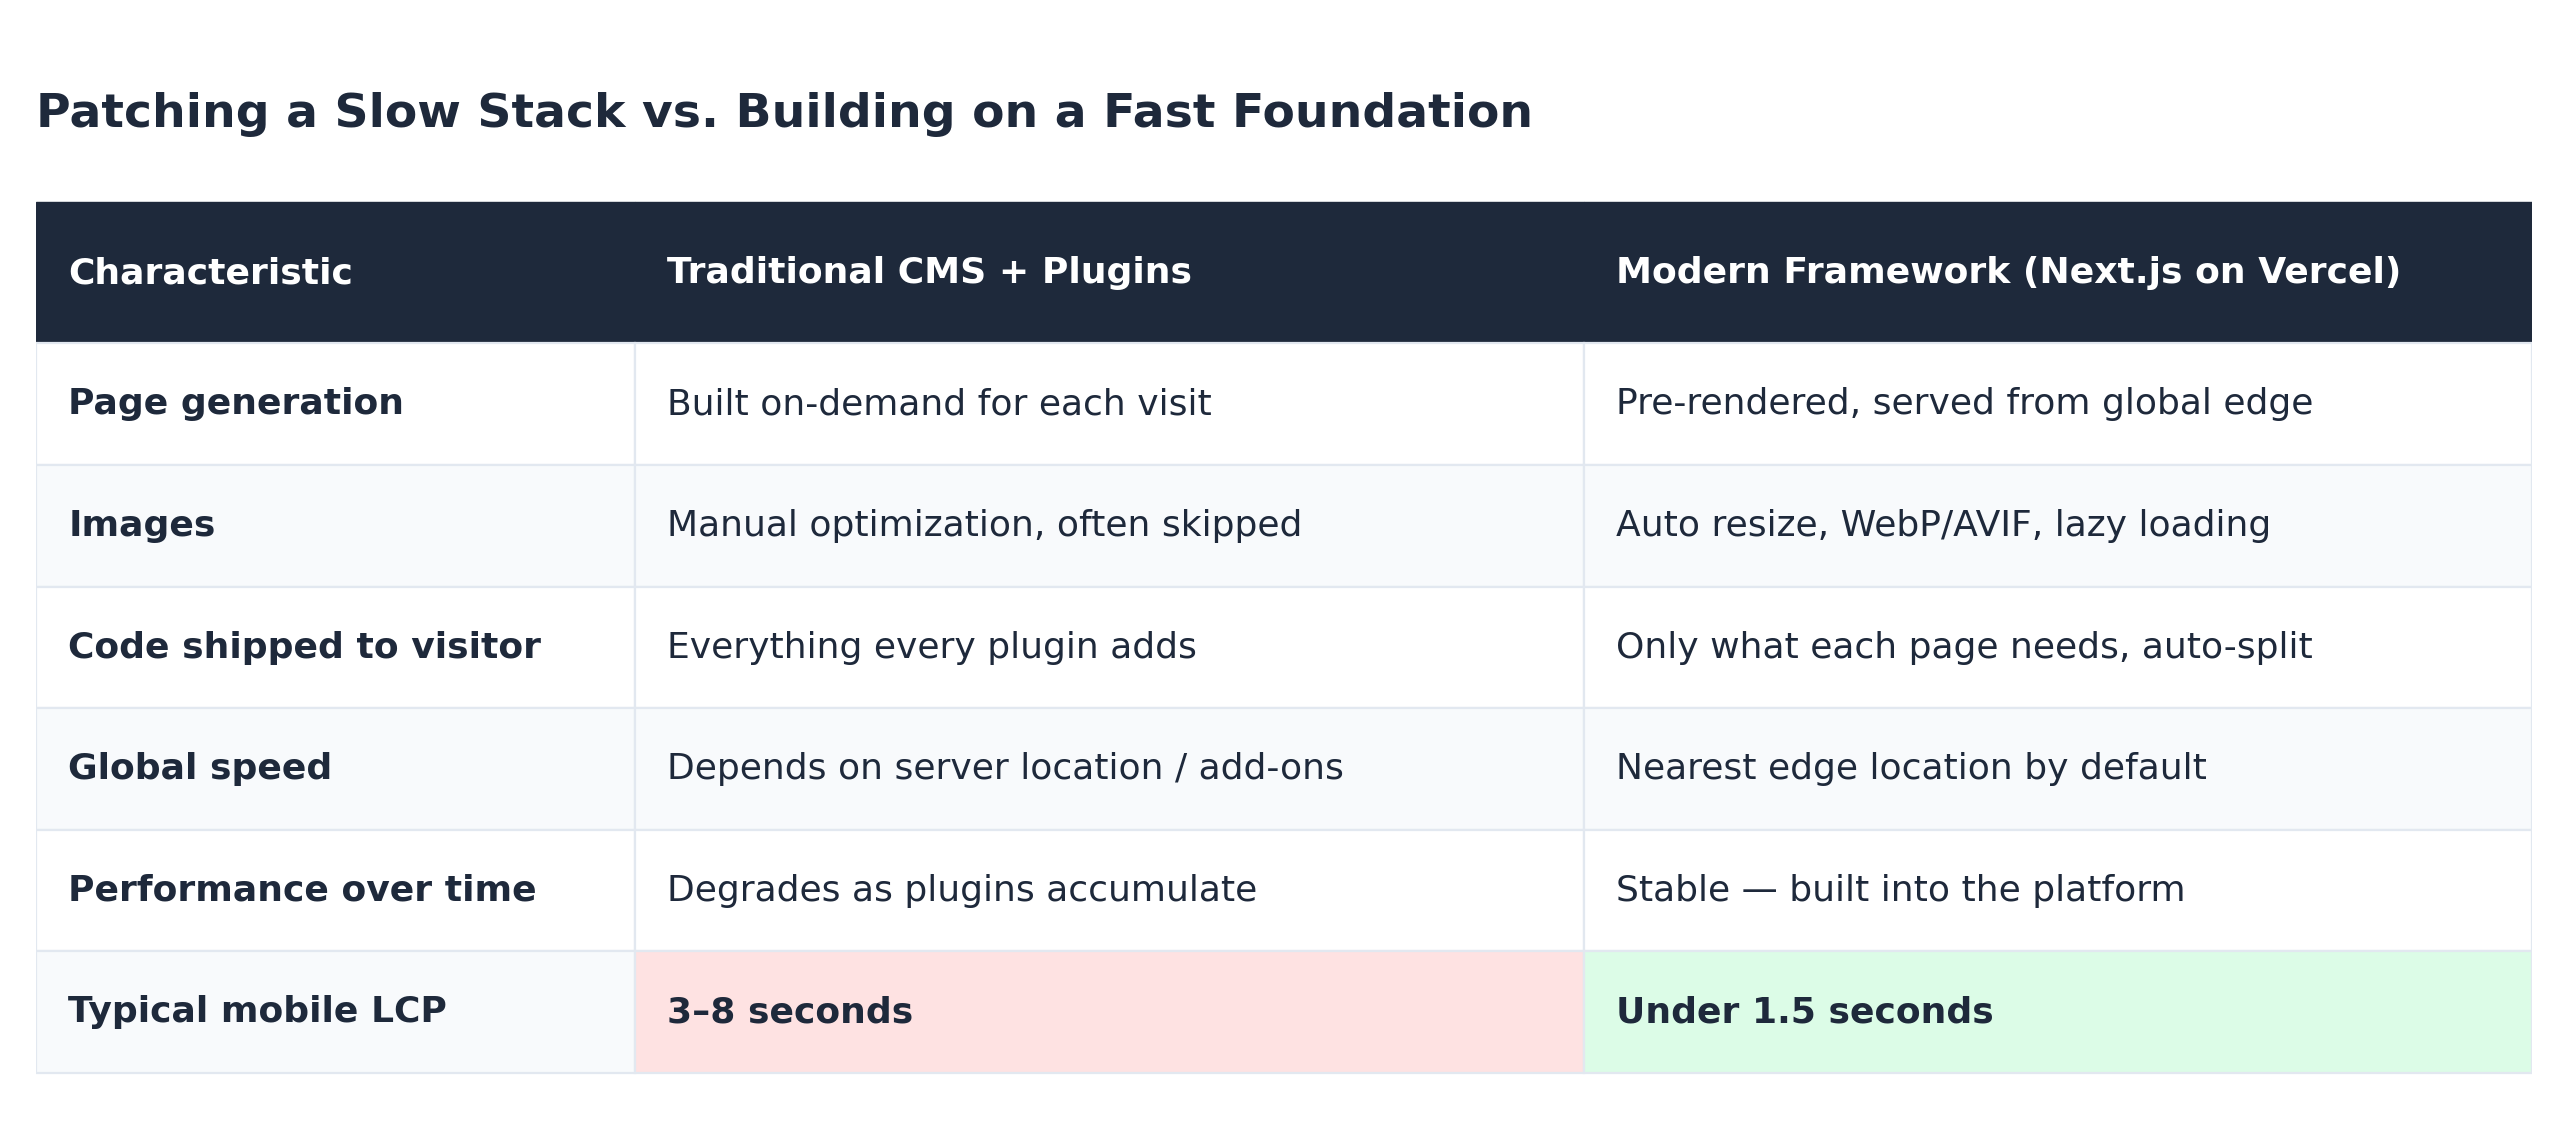
This is the approach we take with every TechBuild.me website. Sites built on our TechBOS platform run on Next.js and deploy to Vercel's edge network, with image optimization, code-splitting, and global delivery working automatically — which is why our client sites routinely score in the green on all three Core Web Vitals without ongoing "speed maintenance." The booking systems, CRM, and lead capture we covered in our contact form article all live inside that same fast architecture rather than being bolted on as third-party scripts that slow it down.
The honest guidance: if your current site's problems are cosmetic, patch it. If it's architecturally slow — heavy builder, plugin-dependent, budget hosting — the patching path costs real money too, and you end up maintaining a compromise. A rebuild on a fast foundation is often comparable in cost and permanent in result.
Part 7: Your Performance Action Checklist
Here's the whole guide condensed into an actionable sequence — start with the ten-minute diagnosis, work through the fixes in order of impact, and verify in Search Console:
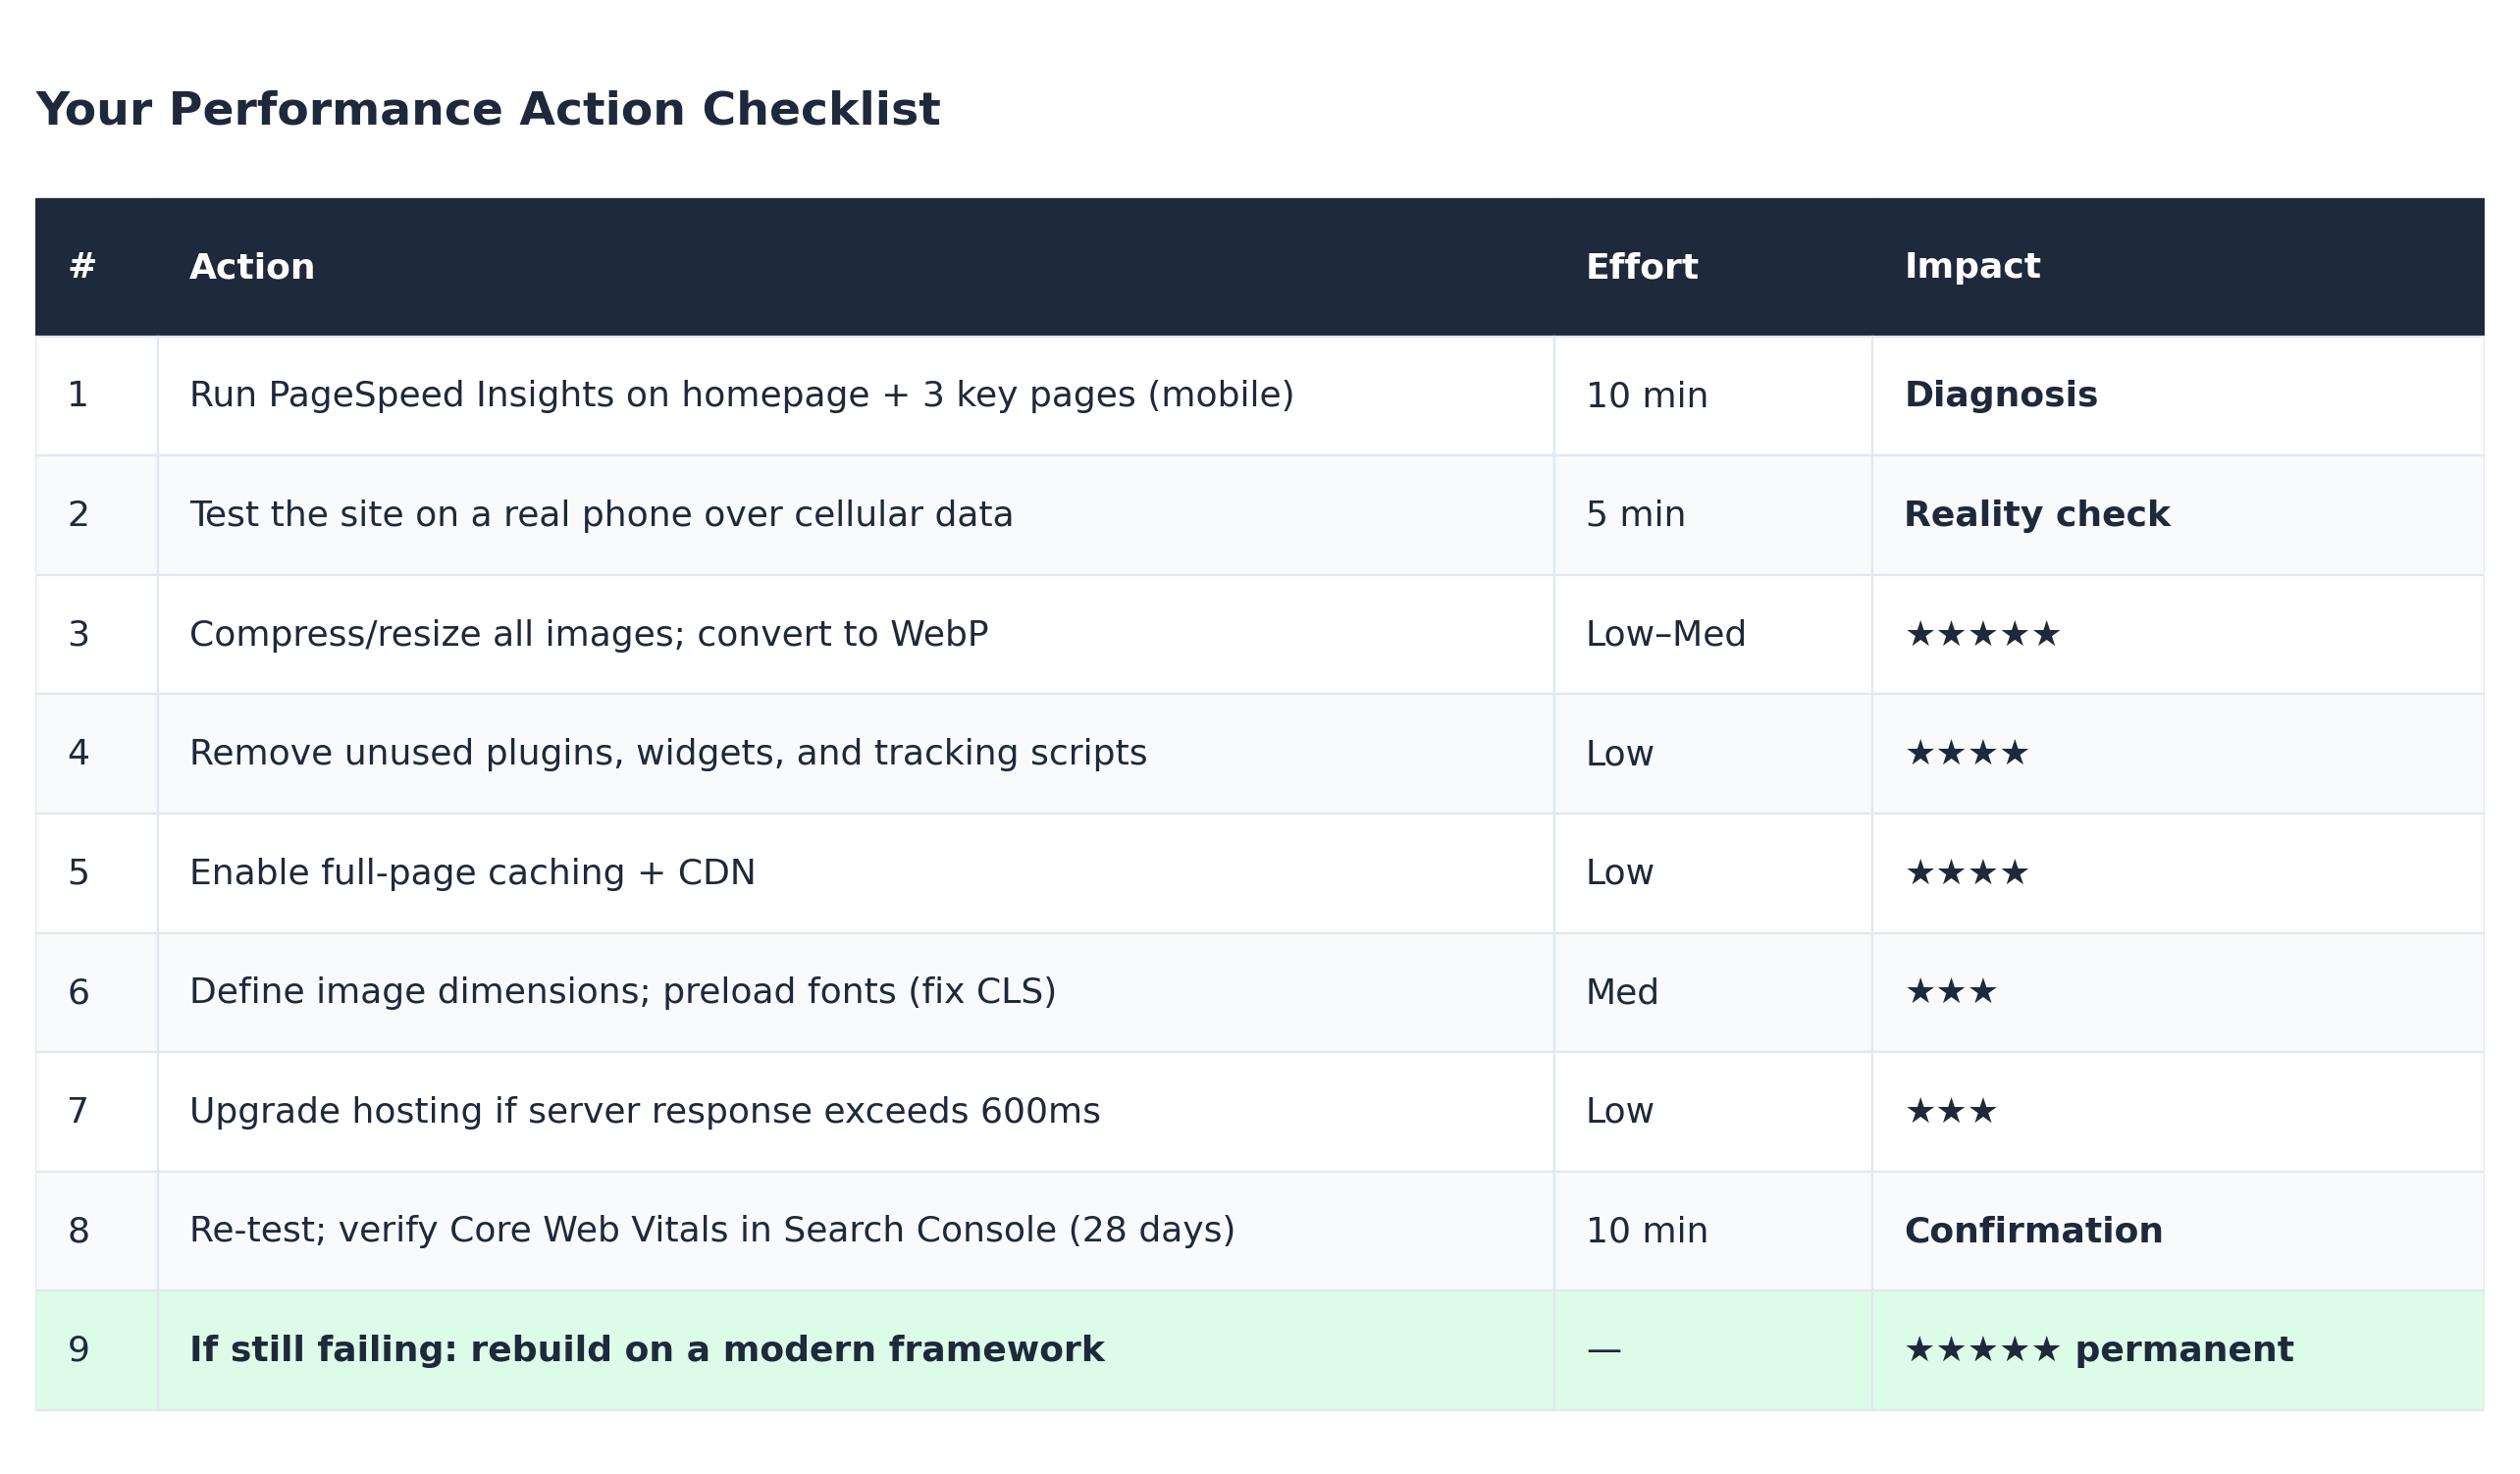
Set a standard for your business: main content visible in under 2.5 seconds on a mid-range phone with average cellular data. That's not an elite benchmark — it's the minimum bar for competing online in 2026.
The Bottom Line
Website performance is the rare business investment that pays out four ways at once: more visitors stay, more of them convert, Google ranks you higher, and every dollar of marketing you spend works harder because fewer clicks are wasted on a page that never loaded.
The businesses losing this game usually don't know they're playing it. Their site looks fine on the office Wi-Fi, so the leak stays invisible — while somewhere between 40% and 90% of their mobile visitors quietly disappear into the wait.
Now you know how to see it, measure it, and fix it.
Want to skip straight to the answer? Book a free performance and strategy call with TechBuild.me. We'll run a full speed and Core Web Vitals audit on your current site, show you exactly what it's costing you in leads, and give you a clear plan to fix it — whether that's optimizing what you have or rebuilding on a foundation that's fast by default.
Ready to Build Something?
Book a free 30-minute strategy session — we'll map out exactly what your business needs online.